
Losing employees regularly, especially in the first 90 days, can feel like a constant setback.
Projects stall, recruiting costs pile up, and remaining team members end up juggling extra work, which can quickly lead to burnout. The attrition rate is the percentage of employees who leave your organisation over a specific period.
Remember, attrition is always measurable, diagnosable, and fixable.
In this guide, we’ll break down everything you need to know about employee attrition rate: what it is, how to calculate it (annual, quarterly, monthly, and early attrition), what counts as “high,” and how to diagnose root causes before they spiral. You’ll also get 12 practical strategies to reduce attrition, from quick wins for new hires to long-term structural fixes. Let's get started.
What is the attrition rate? Measures the percentage of employees leaving over a period, including voluntary and involuntary exits, helping track workforce stability and retention effectiveness.
Attrition vs turnover vs retention. Attrition focuses on long-term workforce reduction, turnover includes all separations, and retention measures employees who stay. Each metric has different use cases for HR and leadership.
Common Types of Attrition. Voluntary, involuntary, early, functional/dysfunctional, internal transfers, and demographic-specific attrition—understanding types helps diagnose causes and take targeted action.
How to calculate attrition. Use the formula: (Employees who left ÷ Average headcount) × 100. Can be measured annually, quarterly, monthly, or for early exits (0–90 days).
How to reduce attrition. Strategies include competitive pay, career growth opportunities, improved onboarding, manager coaching, flexible work policies, recognition programs, and dashboards to track trends.
Attrition rate is the percentage of employees leaving an organisation over a period of time. This helps track workforce stability and retention effectiveness. Tracking attrition enables you to answer questions like:
Are we losing employees faster than we can hire?
Which teams or roles are most at risk?
Are our retention strategies actually working?
It can include both voluntary exits (resignations) and involuntary exits (terminations, layoffs, retirements). By monitoring both, businesses can understand not just how many people are leaving, but why, and take targeted action to reduce turnover and strengthen the organisation.
For example, a tech startup experiencing increased attrition might attribute this to burnout or a lack of career growth opportunities. Tracking this data ensures you’re not just reacting to the problem but actively working to improve employee retention.
Organisations often track turnover and retention as well, but these metrics measure slightly different aspects of workforce movement.
Knowing the differences helps you choose the right metric for strategic planning, operational decisions, or engagement initiatives. Let’s break down how attrition, turnover, and retention differ.
These terms are often used interchangeably, but they measure different aspects of workforce movement and serve different purposes:
Term | What It Measures | Typical Use |
Attrition | The percentage of employees leaving without immediate backfill reflects a longer-term reduction in the workforce | Strategic workforce planning, assessing long-term organisational health |
Turnover | All employee separations, including those quickly replaced | Operational staffing, hiring velocity, and short-term workforce management |
Retention | The percentage of employees who stay over a period | Measuring the success of retention strategies and employee satisfaction efforts |
Your key takeaway here is simple.
Attrition focuses on net loss and long-term workforce stability.
Turnover captures all exits, providing a picture of operational churn.
Retention flips the view to see who stays, helping track engagement and culture effectiveness.
Once you’ve got the formula, it’s worth understanding that not all attrition is equal. Here’s how to categorise it for deeper insight.
Understanding these distinctions helps HR teams diagnose root causes and take targeted action to retain critical talent. Here are the main types of attrition to track, along with what they signal and common ways to address them:
Voluntary Attrition (Resignations): Employees choose to leave, often due to better opportunities, compensation, work-life balance, or dissatisfaction with management.
Involuntary Attrition (Terminations/Layoffs): Employees are asked to leave due to performance issues, restructuring, or cost-cutting measures.
Retirement Attrition: Planned exits when employees reach retirement age. Tracking separately helps in workforce planning and succession strategies.
Internal Attrition (Transfers/Promotions Not Backfilled): When employees move to other roles internally without immediate backfill, it can create gaps in teams and affect productivity.
Demographic-Specific Attrition (DEI Lens): Tracking attrition by gender, age, or other demographics highlights diversity, equity, and inclusion issues. Sample sizes should be large enough to draw meaningful insights.
Functional vs Dysfunctional Attrition: Functional attrition is losing employees whose departure has minimal impact, while dysfunctional attrition is losing high performers or critical role holders, which can hurt productivity, culture, and client relationships.
To make these types of attrition easier to understand at a glance, the table below summarises what each type signals and common strategies to address them:
Type | What It Signals | Common Fixes |
Voluntary | Dissatisfaction, low engagement, better offers elsewhere | Improve compensation, career growth opportunities, and recognition programs |
Involuntary | Performance gaps, poor hiring fit, and restructuring | Better hiring processes, performance management, and role clarity |
Retirement | Ageing workforce, need for succession planning | Early planning, knowledge transfer, and mentorship programs |
Internal | Talent mobility creates gaps | Backfill strategically, cross-training, succession planning |
Demographic-specific | DEI issues, inequitable treatment | Diversity initiatives, inclusion programs, targeted retention plans |
Functional vs Dysfunctional | Critical talent loss | Focused retention strategies for high performers, mentoring, and competitive rewards |
Understanding the various types of attrition gives you a complete view of why employees leave and which areas of your organisation need attention.
Once you identify the root causes, the next step is simple for you to quantify the trend, and that’s where calculating your attrition rate comes in.
Measuring attrition accurately is the first step toward managing it effectively. Here’s how to calculate it for different time periods and employee cohorts.
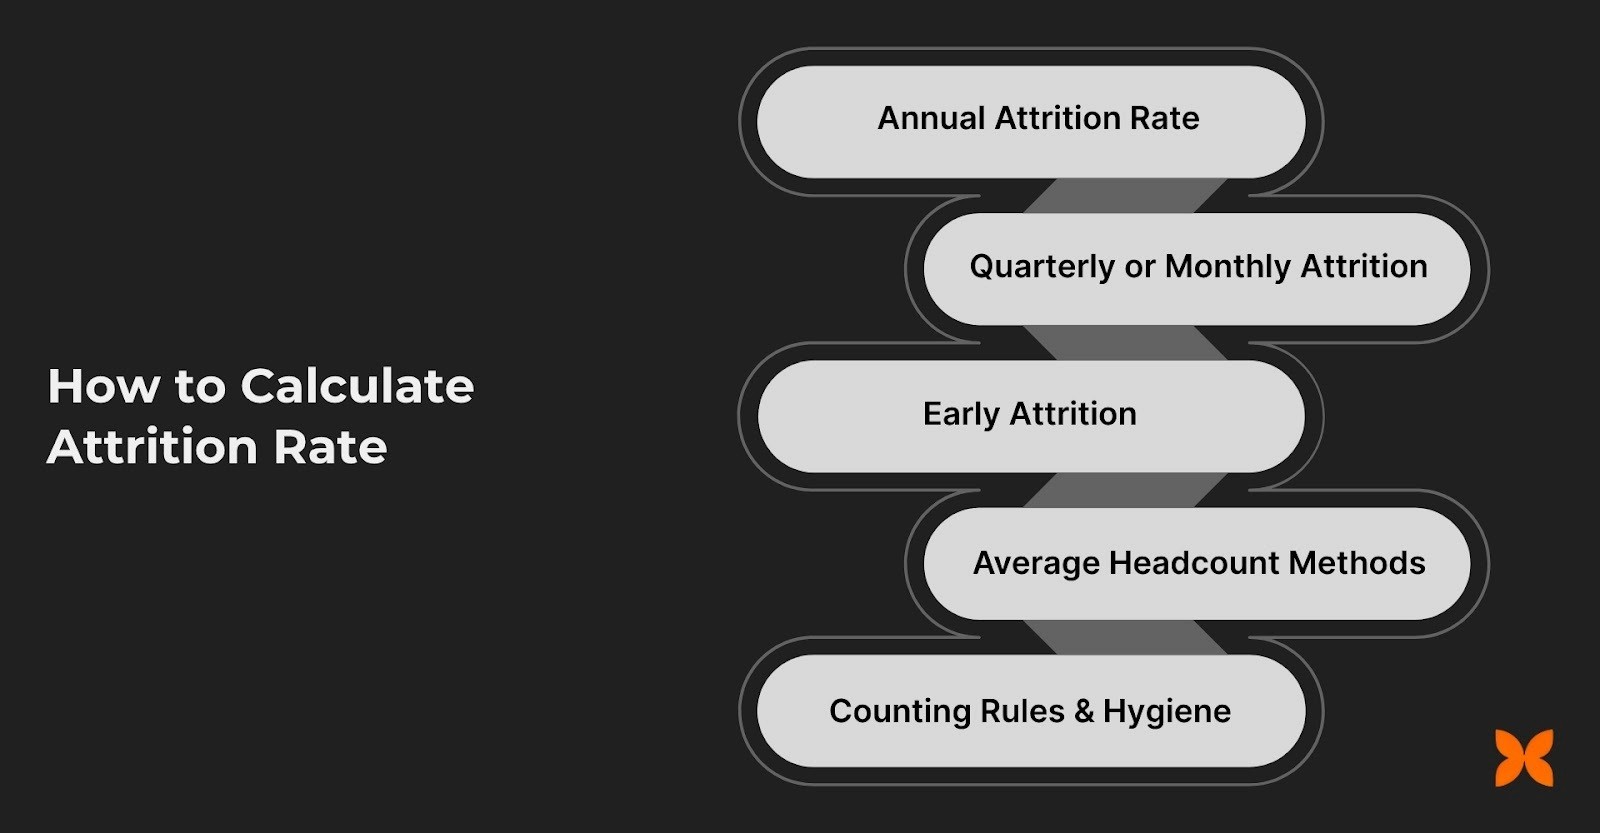
Annual Attrition Rate (Standard Formula)
The most common calculation is annual attrition:
Attrition Rate (%)= Employees who left during the yearAverage number of employees during the year X 100
Take this example,
Employees at the start of the year: 120
Employees at the end of the year: 130
Employees who left during the year: 24
Average number of employees = (120 + 130) ÷ 2 = 125
Attrition rate = (24 ÷ 125) × 100 = 19.2%
This tells you that nearly 1 in 5 employees left your organisation over the year.
Quarterly or Monthly Attrition
The same formula applies for shorter periods:
Attrition Rate (%)= Employees who left during the Month/QuarterAverage number of employees during the Month/QuarterX 100
Note: Shorter periods can show more volatility, especially in small teams, so interpret monthly or quarterly numbers carefully.
For example (monthly),
Employees at start of month: 50
Employees at the end of the month: 52
Employees who left in the month: 3
Average headcount = (50 + 52) ÷ 2 = 51
Monthly attrition rate = (3 ÷ 51) × 100 = 5.9%
Early Attrition (First 30–90 Days)
Early attrition focuses on employees who leave shortly after joining. It’s a key signal of onboarding effectiveness and role clarity.
Use the same formula, but restrict the numerator to new hires who left and the denominator to total new hires during the period.
For example,
New hires in the last quarter: 20
New hires who left within 90 days: 4
Early attrition = (4 ÷ 20) × 100 = 20%
Average Headcount Methods
When start–end averages are misleading due to rapid growth or seasonal hiring, use period-based averages, such as:
Average Headcount = Arithmetic mean of monthly headcount across the period
For example,
Monthly headcount: 100, 110, 115, 120
Average headcount = (100 + 110 + 115 + 120) ÷ 4 = 111.25
This method smooths out fluctuations and gives a more accurate picture of attrition.
Counting Rules & Hygiene
To maintain consistency and reliability:
Clearly define who counts as a “leaver” (resignation, termination, layoff, retirement, end of contract).
Avoid double-counting internal transfers or promotions.
Document exclusions in your HR policy and apply consistently across periods.
Accurate measurement is critical for benchmarking, identifying problem areas, and implementing strategies to reduce attrition.
Now, it’s natural to ask: what counts as “good” or “high”? Understanding benchmarks helps you interpret the numbers and decide when action is needed.
There’s no universal “perfect” attrition rate. What’s considered healthy depends on several factors, including:
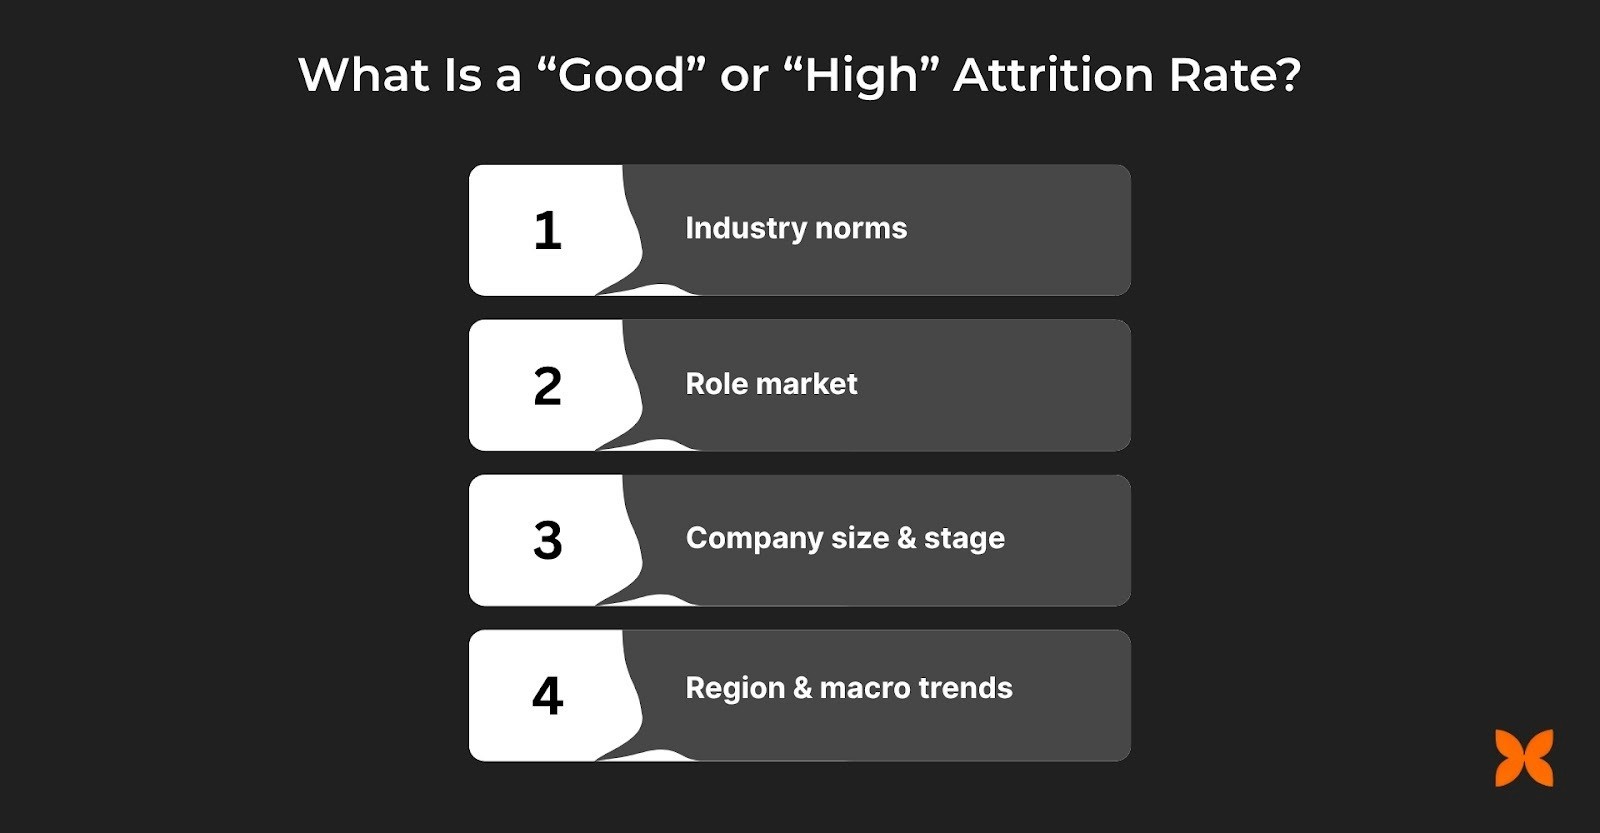
Industry norms: Tech startups vs. manufacturing firms will have very different expectations.
Role market: Highly sought-after roles tend to experience higher movement.
Company size & stage: Rapidly growing organisations may experience higher churn.
Region & macro trends: Local labour market dynamics and economic conditions affect turnover.
Directional guidance: As a general screening threshold, attrition above >20% annually is often considered high, but this is not a hard rule.
The most reliable benchmark is your own historical data. Compare your current attrition to your 12–24-month baseline and peer set. Track trends over time rather than focusing on a single snapshot.
Rather than fixating on a single number, focus on trends, patterns, and critical areas like early attrition or high-performer loss, which signal deeper issues.
Knowing whether your attrition rate is high or low is just the start. The real question for business leaders is: why should this number matter to the business? High attrition isn’t just an HR metric. It hits your bottom line, team morale, and operational efficiency.
Attrition affects your business in ways that go beyond the immediate numbers. Understanding both the visible and hidden costs helps you make a strong case for retention strategies.
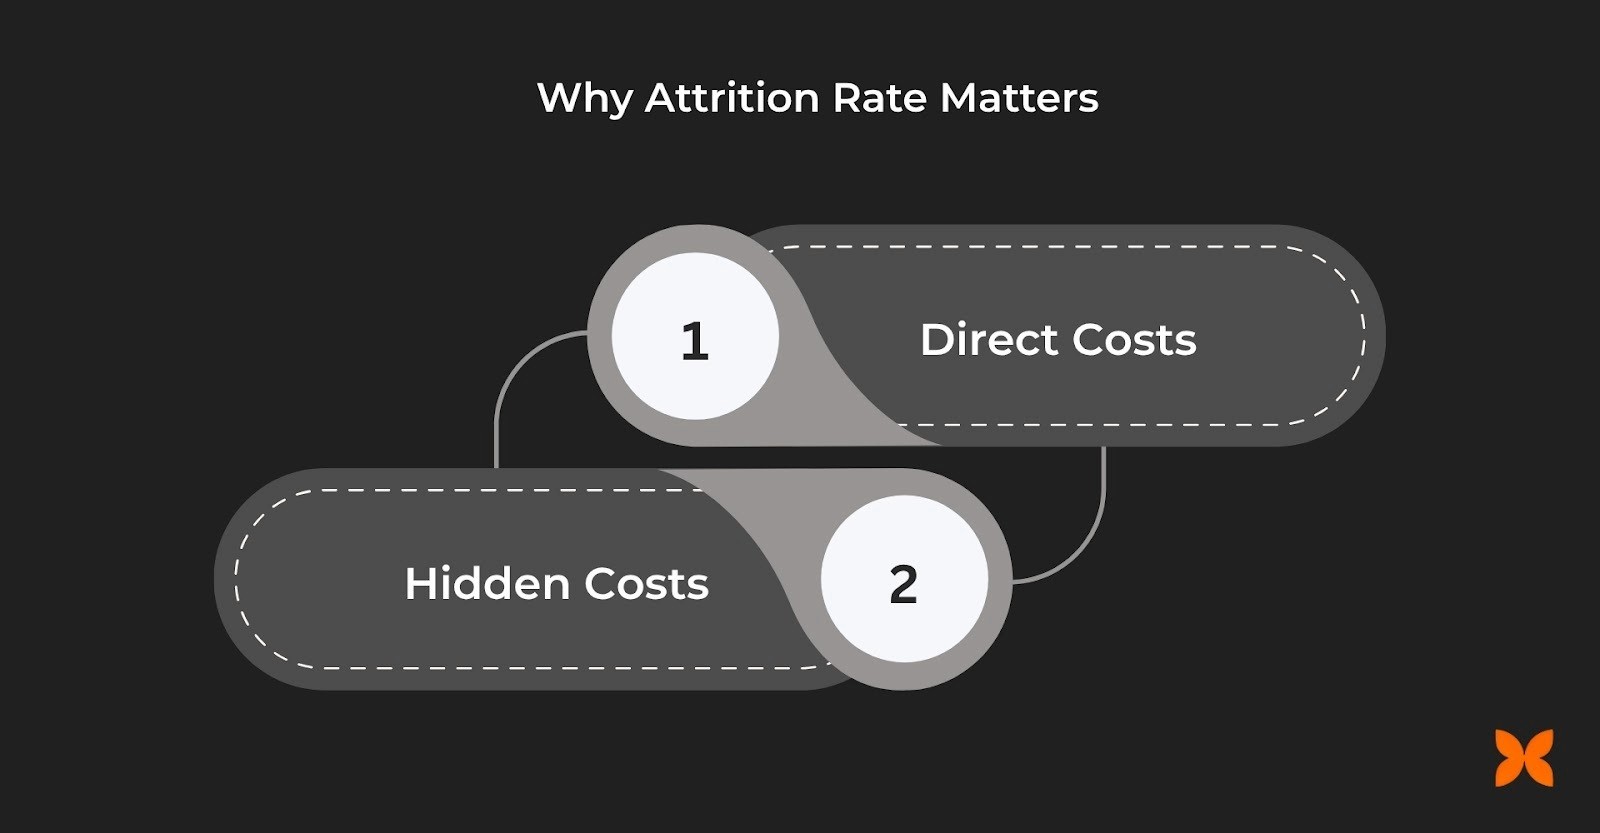
Direct Costs
High attrition means spending more on:
Recruiting: Job postings, agency fees, and interview time.
Onboarding & Training: New hires need ramp-up time, which slows team productivity.
Time to Productivity: The departure of each employee creates a temporary skills gap, ultimately reducing overall output.
Hidden Costs
Some costs aren’t on the balance sheet, but they hurt just as much:
Knowledge Drain: Experienced employees take institutional know-how with them.
Delivery Delays: Projects stall as teams scramble to fill gaps.
Morale Impact: Frequent departures demotivate remaining staff.
Manager Bandwidth: Leaders spend more time hiring and training instead of driving strategy.
Employer Brand: High turnover signals instability to potential hires.
Continuity Risks: High turnover affects key clients, initiatives, and critical roles.
Attrition isn’t just an HR problem. It’s the overall business problem if not considered. Tracking it closely gives you the insight to protect your team, your projects, and your growth trajectory.
High attrition rarely happens by accident. Understanding why employees leave and spotting early warning signs enables you to address problems before they escalate.
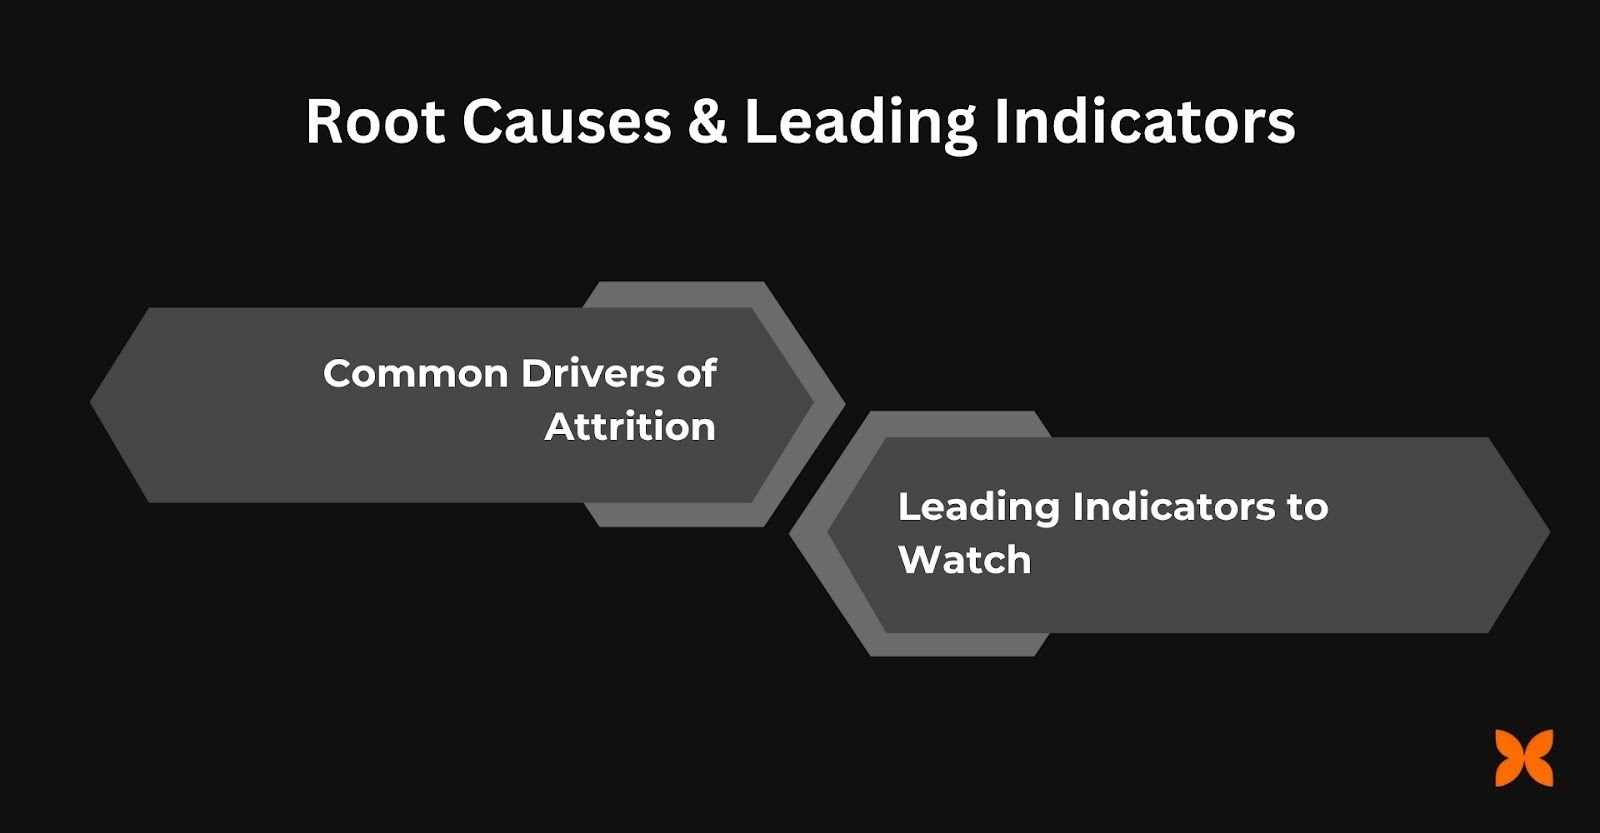
Common Drivers of Attrition
The following are some of the key factors that most often push employees to leave.
Compensation & Total Rewards: Employees expect pay and benefits aligned with market standards. Uncompetitive packages or inconsistent bonuses can push talent to competitors.
Manager Quality & Leadership: Even talented teams can be led by poor managers. Lack of coaching, inconsistent feedback, or unfair treatment drives attrition more than perks or titles.
Work Environment & Culture: Psychological safety, inclusion, and respect matter. A toxic culture or lack of recognition quickly erodes engagement.
Career Growth & Learning: Limited promotion paths, unclear career frameworks, or minimal internal mobility frustrate employees who want to grow.
Workload & Flexibility: Burnout from unrealistic workloads or rigid schedules is a leading reason employees exit, especially in fast-moving startups.
Industry trends indicate that, as hiring needs slow down across many sectors, including IT, efforts towards strengthening retention are paying off. This emphasises the need for competitive benefits and a supportive work culture.
Also Read: 10 Latest HR Trends That Matter Most in 2025
Leading Indicators to Watch
Before attrition spikes, subtle signs often appear. Track these metrics to diagnose risks early:
Engagement & Pulse Scores: Drops in survey results or low participation can indicate dissatisfaction.
Manager Effectiveness: High team attrition or low feedback scores signal leadership gaps.
Promotion & Internal Mobility Velocity: Employees staying in the same role too long are more likely to leave.
Pay Compa-Ratio & Raise Timing: Market misalignment or long periods without raises can trigger exits.
PTO Overhang & Overtime: Excess unused leave or consistent overwork suggests burnout risk.
By combining a clear understanding of why people leave with what early warning signs to watch, you can move from reactive firefighting to strategic retention management—saving your team, your projects, and your growth trajectory.
The best strategies are a mix of quick wins, mid-term fixes, and structural initiatives that not only stop employees from leaving but also build a stronger, more engaged workforce.
Reducing attrition is also about creating systems and habits that keep your people engaged, motivated, and growing. The following 12 strategies give you a clear roadmap, from quick fixes to long-term structural improvements.
Quick Wins (0–30 Days)
Start with the easiest changes that create immediate impact:
#1 Close pay gaps for hot roles: Ensure compensation matches market rates to prevent top performers from leaving.
#2 Reset manager 1:1s and recognition norms: Weekly check-ins and regular shout-outs go a long way in boosting morale.
#3 Run stay interviews & standardise exit interviews: Learn why your best people stay and why others leave, then act on those insights.
Next 30–90 Days
Build on the quick wins with improvements that take a little more planning:
#4 Overhaul onboarding: Use buddy systems and 30-60-90 day plans to help new hires settle in smoothly and feel part of the team.
#5 Publish career frameworks and internal mobility paths: Make growth opportunities visible so employees see a future with you.
#6 Introduce flexible work norms & workload guardrails: Let employees manage their schedules while preventing burnout.
Structural (90–180+ Days)
Focus on long-term systems that keep attrition low over time:
#7 Manager development programs: Train leaders in coaching, feedback, and fairness to improve team experience.
#8 Employee listening system: Combine engagement surveys, pulse checks, and closed-loop action tracking to catch issues early.
#9 Recognition & growth budget: Provide L&D stipends, mentorship, and development opportunities to engage top talent.
#10 Performance & progression transparency: Clear promotion criteria and calibration reduce frustration and stagnation.
#11 Succession planning: Protect critical knowledge and ensure business continuity when key employees leave.
#12 Alumni & Boomerang Strategy: Maintain a positive employer brand to rehire regretted exits and strengthen your talent network.
Reducing attrition is about a structured, multi-layered approach, from immediate fixes to long-term systems that keep employees engaged, recognised, and growing within your organisation.
Taking action to reduce attrition is essential, but it’s equally important to measure and understand the impact of those actions. Without proper analysis, you might be fixing symptoms rather than addressing the real causes. That’s where a structured approach to attrition analysis comes in.
Before you implement retention strategies, you need a clear picture of where attrition is happening, why it’s happening, and which areas to prioritise. An effective analysis goes beyond overall percentages—it digs into trends, patterns, and early warning signs so you can take data-driven action.
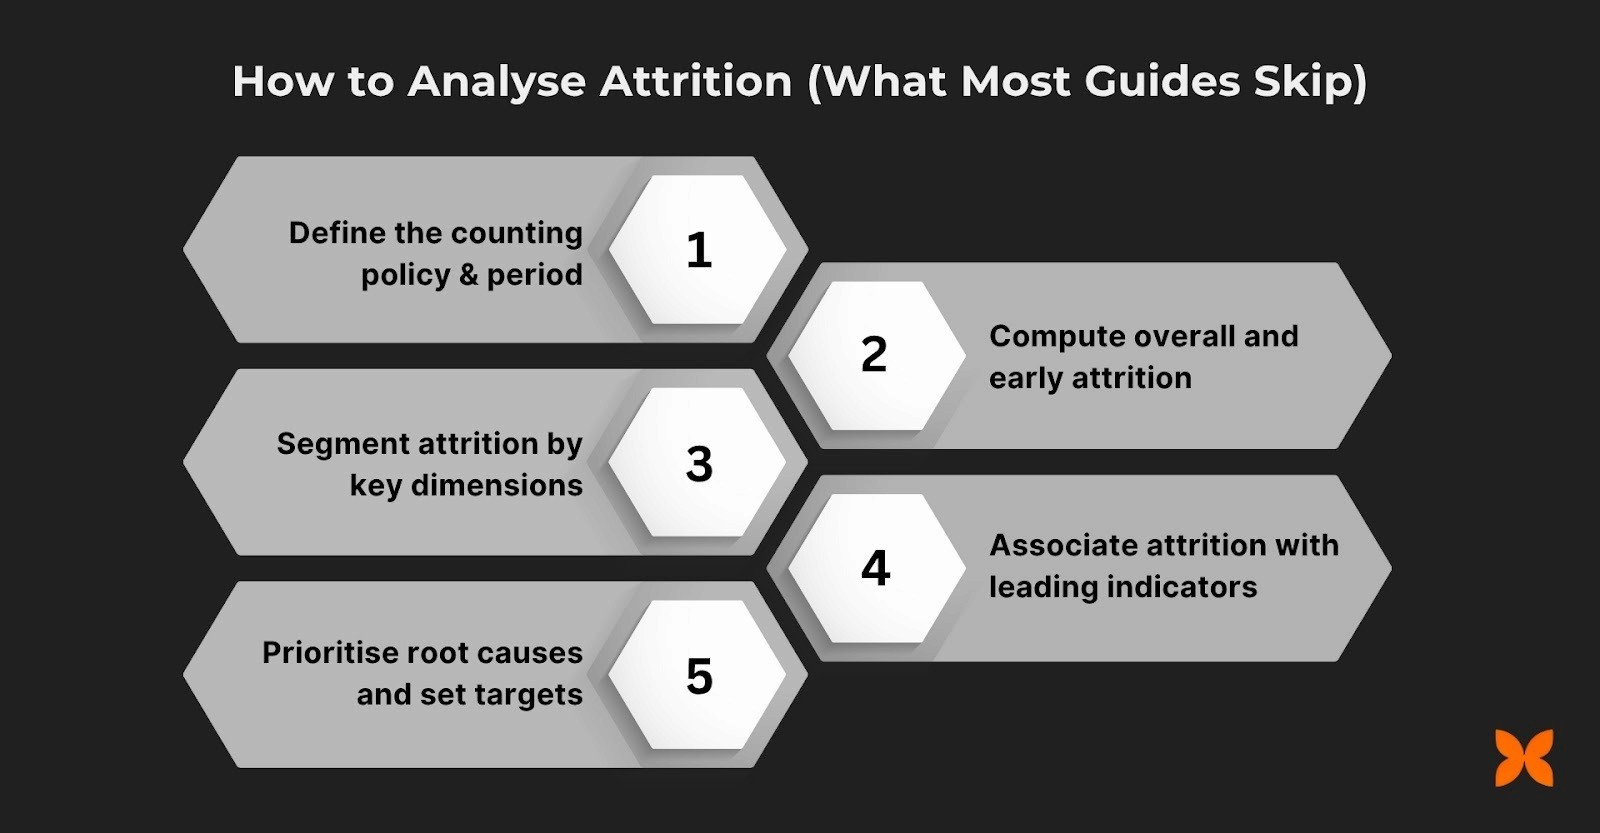
Here’s a simple 5-step method to get started:
Define the counting policy & period – Decide who counts as a “leaver” (resignations, terminations, retirements, end of contract) and the timeframe for analysis. Consistency here ensures reliable comparisons.
Compute overall and early attrition – Track annual and trailing-12-month attrition alongside early attrition (0–90 days). This helps identify problems in onboarding or early engagement.
Segment attrition by key dimensions – Break down attrition by function, manager, level, tenure cohort, location, and demographics. Respect privacy and ensure sample sizes are statistically meaningful.
Associate attrition with leading indicators – Overlay data like engagement scores, promotion velocity, pay compa-ratio, manager effectiveness, overtime, and time-since-last-raise. This highlights root causes before they become bigger issues.
Prioritise root causes and set targets – Focus on 2–3 main drivers of attrition, implement the strategies discussed earlier, and set realistic target ranges (for example, early attrition <10% within two quarters).
Pro tip: Visualising attrition trends over time can make insights more actionable. Consider including a monthly cohort curve for new hires to identify early drop-offs and proactively adjust onboarding or management practices.
Once you’ve analysed attrition and pinpointed the root causes, the next step is to turn data into action. Having the right tools and dashboards not only makes tracking easier but also gives leaders a clear, real-time view of trends—so you can act before issues escalate.
The best dashboards combine overall metrics with segmented insights, allowing HR and leadership to identify risk areas, spot trends, and measure the impact of retention initiatives.
Key Metrics to Track:
Overall attrition: The total percentage of employees leaving in a period.
Early attrition: Exits within the first 30–90 days, highlighting onboarding or role-fit issues.
Regretted/dysfunctional attrition: Loss of high performers or critical talent.
Top-performer attrition: Specific focus on star employees whose departure has the biggest impact.
Internal mobility rate & promotion velocity: Shows how effectively employees are growing within the organisation.
Engagement & manager effectiveness: Leading indicators of potential attrition risk.
Dashboard Views That Work:
Trend lines (TTM): Track attrition over time to spot long-term patterns.
Heatmaps by org/manager: Highlight high-risk teams or leaders driving attrition.
Cohort panels (new-hire survival): Visualise retention for new employees to improve early engagement.
Exits by reason (taxonomy): Categorise departures to understand “why” employees leave.
Early attrition KPI tiles: Quick visibility into first 90-day retention performance.
With the right combination of metrics and dashboards, organisations can turn attrition data into actionable insights, prioritising interventions, improving retention, and ultimately protecting both people and business performance.
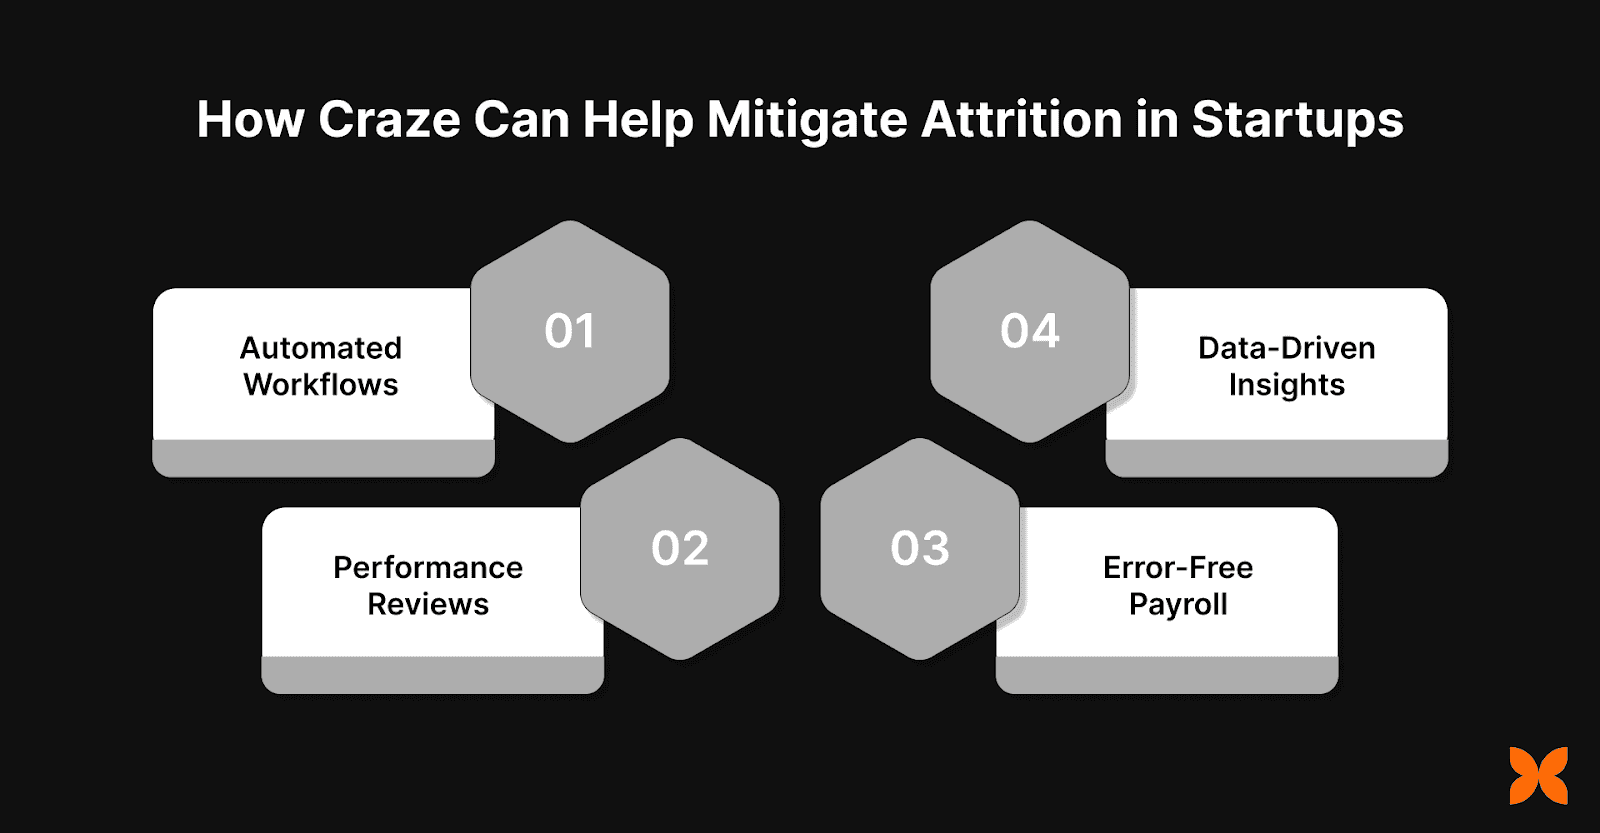
Craze is designed to solve some of the most common HR and operational pain points that startups and SMEs face when dealing with high attrition rates. It provides startups with the tools they need to manage employee data and reduce turnover effectively.
Automated Workflows for Smooth Onboarding and Offboarding: Craze streamlines the onboarding process by automating key steps such as document completion, getting personal & payroll details, compliance checks etc . This ensures a seamless experience for new hires, improving their engagement and reducing early attrition.
Performance Reviews with Real-Time Feedback: With Craze’s performance management system, you can get 360-degree feedback and real-time tracking of performance. It helps employees receive regular feedback and businesses align goals effectively.
Error-Free Payroll and Compliance: This platform helps you in accurate calculation of salary, taxes, and benefits while maintaining compliance with Indian labour laws, reducing errors and frustrations that could lead to attrition.
Data-Driven Insights for Improved Retention Strategies: Its comprehensive reporting tools allow you to track turnover, analyse attrition trends, and implement data-backed strategies to improve employee retention.
With these features, Craze ensures compliance and minimises operational errors. This holistic approach to people management is exactly what growing teams need to solve the attrition problem and thrive.
Also Read: Employee Database Management System for HR Leaders: What It Is, How It Helps, and How to Choose
By addressing these key factors, you can build a more engaged and loyal workforce, and Craze’s tools make it easier to implement these strategies effectively.
Employee attrition measures the percentage of staff leaving an organisation and signals the health of culture, leadership, and career growth opportunities. Not all attrition is equal—voluntary, involuntary, early, functional, and dysfunctional exits each have different implications. Accurate calculation, using annual, quarterly, monthly, and early metrics, helps benchmark trends and identify high-risk areas.
High attrition carries both visible costs, like recruitment and training, and hidden costs, such as morale and knowledge loss. Businesses can reduce turnover through targeted strategies: competitive pay, career development, improved onboarding, manager coaching, flexible work policies, and real-time dashboards to track and act on retention insights.
Q1. What is the attrition rate formula?
The attrition rate measures the percentage of employees leaving over a period. Use the formula: (Number of employees who left ÷ Average number of employees) × 100. This helps track workforce stability and identify trends.
Q2. How do you calculate monthly attrition?
Monthly attrition is calculated using the same formula as annual attrition but focused on a one-month period. Because smaller periods have smaller denominators, percentages can fluctuate more. Tracking monthly attrition helps identify early warning signs before issues escalate.
Q3. What is considered a high attrition rate?
While benchmarks vary by industry and role, attrition above 20-30% is generally a red flag. High attrition indicates underlying issues with culture, leadership, compensation, or growth opportunities, and should prompt a deeper review of retention strategies.
Q4. What is early attrition, and why track it?
Early attrition refers to employees leaving within their first 30–90 days. It often signals problems with onboarding, role clarity, or cultural fit. Monitoring early attrition helps organisations improve the initial experience, reduce turnover, and retain critical talent.
Q5. Does attrition include layoffs, retirements, or internal transfers?
Whether to include involuntary exits like layoffs, retirements, or internal transfers depends on company policy. Define what counts as a “leaver” clearly and apply it consistently to ensure accurate tracking and meaningful insights for retention planning.