
When you’re running HR operations in a growing business, you quickly realise something: the cost of HR is rarely the HR team’s salaries alone. It’s the hidden hours spent chasing approvals, fixing payroll errors, reconciling attendance, answering repetitive queries, and patching gaps between tools.
That is where HR software ROI comes in.
Not as a vague “HR tech is good” story, but as a CFO friendly way to answer a simple question:
If we invest in HR software, what do we get back in money, time, and reduced risk?
In this guide, you’ll learn how to calculate ROI with a simple formula, build a baseline that Finance will trust, model realistic scenarios, and then increase returns over the first 30, 90, and 180 days.
HR software ROI is not subscription cost vs headcount. It’s the net financial impact of operational improvements divided by total cost of ownership.
The biggest ROI drivers usually include time savings, reduced errors, faster onboarding to productivity, lower compliance risk, and tool consolidation.
ROI is strongest when you measure from day one, improve adoption, and redesign workflows around the system.
A realistic ROI plan includes two scenarios and a payback period, not one optimistic number.
Integrated HR, payroll, compliance, and IT workflows often produce higher ROI than stitched together tools because they remove handoffs and rework.
Now that you know what we’re aiming for, let’s clarify what ROI actually means in the context of HR software.
HR software ROI is the return you get from implementing HR software, measured as:
Tangible savings (money you can directly quantify)
Efficiency gains (hours saved that translate into cost avoidance or capacity for higher value work)
Risk reduction (fewer compliance issues, fewer payroll mistakes, fewer audit fire drills)
Scalability benefits (the ability to grow headcount without growing admin load at the same rate)
It helps to separate ROI into two buckets because not every business benefit belongs inside a spreadsheet.
1) Tangible returns (include these in your ROI calculation)
These are measurable in currency with reasonable confidence:
HR and payroll admin hours saved
Fewer payroll corrections and rework
Lower payroll vendor fees
Reduced subscription costs after consolidating tools
Reduced compliance penalty exposure (where you can quantify it)
2) Intangible returns (report these separately, but do not force them into the ROI number)
These matter a lot, but the numbers can be subjective:
Better employee experience
Better visibility for leadership decisions
Higher trust in payroll and HR data
Better manager accountability
Stronger audit readiness and governance
A clean approach is:
Use tangibles for ROI
Use intangibles for stakeholder narrative
Once you draw this line, ROI becomes easier to calculate and much easier to defend.
ROI formula
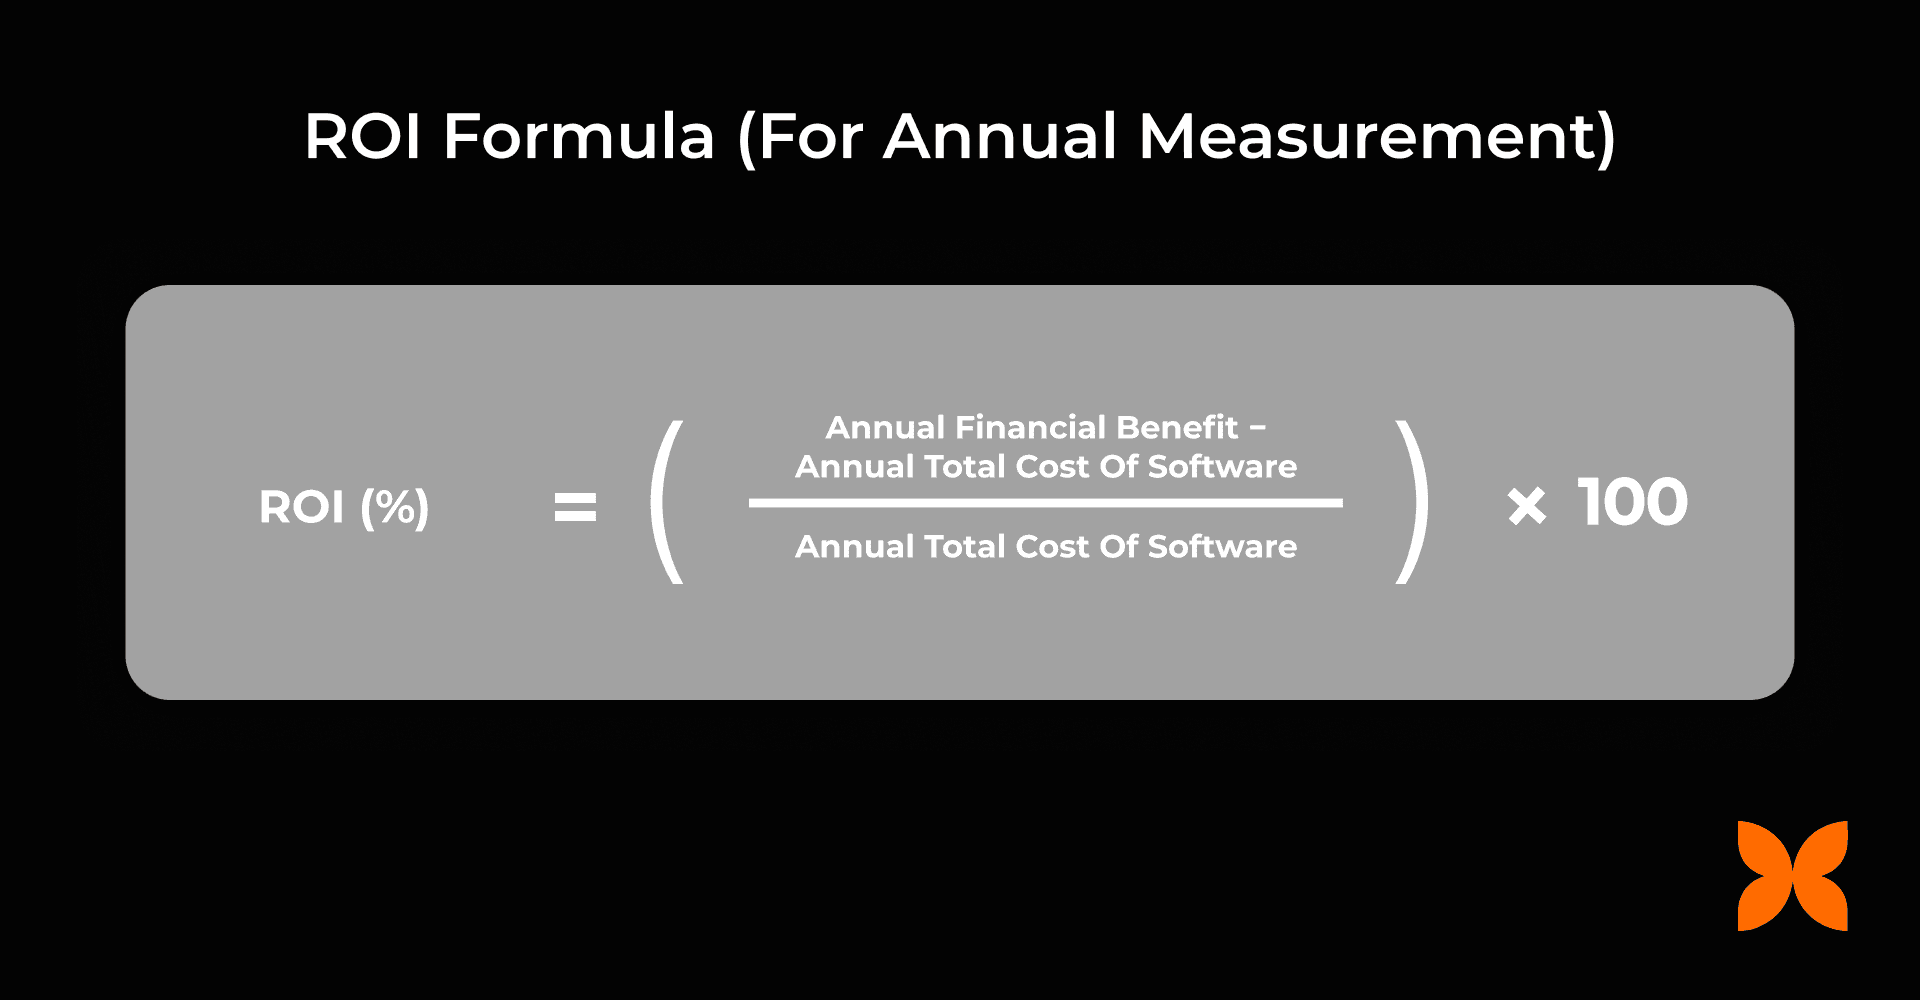
ROI (%) = [(Annual Financial Benefit − Annual Total Cost) ÷ Annual Total Cost] × 100
This gives you an annualised view of returns.
And if you’re wondering, “How do I actually calculate annual benefits and annual costs?”, don’t worry, we’ll walk through it step by step in the next section with a practical worksheet and examples.
Payback period (what most leaders ask next)
ROI is useful, but decision makers often care about speed.
Payback period (months) = Total investment ÷ Monthly financial benefit
If your payback period is 3 to 9 months, the investment typically feels easier to justify. If it is 18 months, you will need a stronger long term case and clearer adoption plans.
With the formula in place, the next step is agreeing on what should count as cost and what should count as benefit.
If you only include subscription fees, your ROI number will look better than reality, and Finance will challenge it.
Include:
Annual subscription and module fees
Implementation and onboarding costs (annualise these across the contract term)
Integrations (accounting, attendance devices, identity tools, payroll payout rails)
Training time (HR, Finance, managers, employees)
Support costs (vendor plus internal admin time)
Transition costs (parallel runs or temporary productivity dip during rollout)
This is your total cost of ownership (TCO) for the year.
Now that costs are clear, let’s look at benefits, because this is where most ROI cases either become convincing or fall apart.
Your benefits should reflect how HR work actually happens in growing organisations:
Manual processes create admin drag
Disconnected tools create reconciliation work
Lack of automation creates repeated errors and delays
Lack of structure slows onboarding and approvals
Most ROI calculations become credible when benefits are grouped into a few clear buckets. Here are the ones that show up most often in real finance conversations.
1) Time savings from automation
This is usually the fastest win.
Common areas:
Payroll preparation and processing
Attendance consolidation
Leave approvals and balances
Reimbursements and claims workflows
HR reporting and monthly MIS
Document generation and follow ups
How to monetise:
Hours saved × loaded hourly cost of the people doing the work.
Loaded hourly cost should include salary and employer costs, and you can use a conservative overhead factor if you want to be extra safe.
If you want to keep it simple, use:
(Monthly salary × 12) ÷ 1,920 working hours
(assuming 160 hours per month)
2) Reduced payroll errors and rework
Payroll errors are expensive in two ways: the correction itself and the time spent explaining, reassuring, and reprocessing.
Track:
number of payroll corrections per cycle
time spent per correction
time spent on employee queries
How to monetise:
(Hours saved on correction + hours saved on queries) × loaded hourly cost
3) Faster onboarding to productivity
Onboarding ROI comes from reducing the gap between offer accepted, joining day readiness, and full productivity.
Typical levers:
documentation completion
payroll readiness
device and access provisioning
task tracking for managers
How to monetise:
Days saved per hire × value per day × number of hires per year
If “value per day” is hard, use a conservative proxy:
average daily cost of employee (CTC ÷ working days)
oraverage revenue per employee per day (if you have it)
4) Hiring efficiency improvements (especially if you have ATS)
If your HR software includes recruitment or connects closely with it, ROI can show up earlier than expected.
Track:
time to hire
cost per hire
recruiter hours saved
reduction in agency dependency
drop off reduction from better candidate experience and faster turnaround
Even small improvements here can create meaningful savings when hiring volume is high or when roles are revenue critical.
5) Reduced compliance and audit risk
In India, payroll and statutory compliance can be a quiet drain until it becomes a loud problem.
Measure:
number of compliance issues or delayed filings
professional fees to fix them
time spent collecting data during audits
How to monetise:
Avoided penalties + avoided professional fees + internal hours saved
Be conservative. It makes your ROI case more believable.
6) Tool and vendor consolidation
A common ROI unlock is retiring separate tools for:
attendance
payroll vendor arrangements
HR point solutions
document workflows
asset tracking sheets and tools
How to monetise:
Annual licence fees eliminated + vendor fees eliminated + admin hours saved from reconciliation
At this stage, you know what you will count. The next job is turning that into a baseline and a worksheet that leadership will trust.
You can copy this section into a doc or spreadsheet for your internal business case.
ROI input | Where to get it | Conservative assumption | Aggressive assumption |
|---|---|---|---|
Payroll processing hours per month | HR + Finance calendar | Small reduction | Large reduction |
Payroll query hours per month | HR tickets, Slack, email | Some reduction | Major reduction |
Payroll error correction effort | Past cycles, rework logs | Reduce by a bit | Reduce heavily |
Compliance incident cost per year | Finance records | Only confirmed incidents | Include confirmed + frequent minor issues |
Hires per year | Hiring plan | Stable hiring | Growth hiring |
Days saved per hire | Onboarding checklist | 1–2 days | 3–5 days |
Tools you can retire | SaaS stack list | Retire 1–2 tools | Retire multiple tools |
Implementation cost | Vendor quote | Full cost included | Full cost included |
Training time | HR plan | Higher | Lower with better adoption |
This structure helps you defend the number when someone asks, “Where did this come from?”
Now, let’s apply this worksheet using a clear step by step ROI method.
Step 1: Build your baseline (annual cost today)
Start with what your current system costs you.
Include:
HR admin time cost (salary portion spent on admin)
payroll vendor fees
subscription costs of all HR related tools
payroll correction and query time cost
compliance penalties and remediation cost (if any)
onboarding delays you can quantify
asset loss and delayed recovery costs (if you track them)
You do not need perfect data. You need reasonable and conservative data that Finance will accept.
Step 2: Estimate annual financial benefits (after implementation)
Use the benefit buckets above.
Avoid projecting “everything improves by 50%”. Instead, use:
actual time savings from a pilot
time studies on one payroll cycle
baseline query volume and expected reduction
known tool costs you can retire
Step 3: Calculate annual total cost of ownership
Add:
annual subscription
annualised implementation cost
integrations
training time
support
Step 4: Compute ROI
Apply:
ROI (%) = [(Annual Benefit − Annual TCO) ÷ Annual TCO] × 100
Step 5: Add payback period
Calculate:
Payback (months) = Total investment ÷ Monthly benefit
Then present:
a conservative scenario
an aggressive scenario
Once the maths is clear, worked examples help make it feel real. Let’s look at two.
These examples are simplified on purpose. Replace the assumptions with your own numbers.
Example A: 60 employee company (India based)
Baseline annual costs
HR and payroll admin time: 25 hours per month
Loaded hourly cost: ₹800
Annual admin cost: 25 × 12 × 800 = ₹2,40,000
Payroll errors and corrections: ₹60,000
Asset loss and delayed recovery: ₹1,20,000
Multiple HR and payroll tools: ₹1,80,000
Total baseline cost: ₹6,00,000
Annual financial benefits
Admin time reduced by 60%: ₹1,44,000
Error reduction and rework avoidance: ₹40,000
Faster onboarding (3 days saved per hire): ₹96,000
Better asset recovery: ₹80,000
Tool consolidation savings: ₹1,20,000
Total annual benefit: ₹4,80,000
Annual software cost (TCO): ₹2,40,000
ROI
ROI = [(4,80,000 − 2,40,000) ÷ 2,40,000] × 100
ROI = [2,40,000 ÷ 2,40,000] × 100 = 100%
If adoption is slower and only half the benefits materialise, benefit becomes ₹2,40,000 and ROI becomes 0% in year one. That is exactly why adoption planning matters.
Example B: 300 employee company
Baseline annual costs
HR and payroll admin time: 120 hours per month
Loaded hourly cost: ₹1,000
Annual admin cost: 120 × 12 × 1,000 = ₹14,40,000
Payroll errors and compliance remediation: ₹3,00,000
Asset loss and delayed recovery: ₹6,00,000
Multiple HR, payroll, IT tools: ₹8,40,000
Total baseline cost: ₹31,80,000
Annual financial benefits
Admin effort reduced by 65%: ₹9,36,000
Error and compliance reduction: ₹2,20,000
Faster onboarding at scale (5 days saved per hire): ₹6,00,000
Asset recovery gains: ₹4,80,000
Tool consolidation: ₹6,00,000
Total annual benefit: ₹28,36,000
Annual software cost (TCO): ₹7,20,000
ROI
ROI = [(28,36,000 − 7,20,000) ÷ 7,20,000] × 100
Net benefit = ₹21,16,000
ROI = (21,16,000 ÷ 7,20,000) × 100
ROI ≈ 294%
As you can see, ROI scales quickly when complexity increases. The more handoffs and rework you remove, the larger the return.
The next piece is making sure those returns actually show up in the first six months. That is where a timeline plan helps.
ROI does not show up because software exists. It shows up because behaviour changes.
First 30 days: baseline and quick wins
Focus on:
single source of truth for employee data
payroll workflow setup and first payroll run
leave and attendance stabilisation
employee self service basics
Measure:
payroll processing hours
number of payroll queries
number of payroll corrections
report preparation time
Outcome you want:
payroll closes faster
HR time shifts from manual work to exception handling
Day 31 to 90: expand automation and reduce rework
Focus on:
onboarding workflows and document completion
approvals automation (claims, reimbursements, requests)
compliance reporting consistency
manager usage (approvals, updates, performance touchpoints)
hiring workflow improvements if ATS is included
Measure:
time to onboard a new hire to “ready to work”
time spent on follow ups
compliance effort hours
adoption rates across managers and employees
time to hire and cost per hire (if applicable)
Outcome you want:
fewer follow ups
faster onboarding
fewer recurring payroll and policy issues
Day 91 to 180: consolidation and scale
Focus on:
retiring redundant tools
deeper reporting and workforce visibility
tighter joiner mover leaver controls
asset lifecycle tracking and recovery
consistent recruitment workflows and reporting if ATS is in play
Measure:
tools retired and licence savings realised
asset recovery percentage on exits
audit readiness time and effort
retention, absenteeism, satisfaction trends (report separately)
Outcome you want:
ROI becomes durable and repeatable
growth does not create admin chaos
Once you have a plan, it’s also worth knowing what can derail it. Let’s cover the most common ROI mistakes.
1) Only counting subscription savings
ROI is almost never “we paid X and saved X”. It is “we removed operational drag and reduced risk”.
2) Leaving out implementation and training costs
If your ROI ignores these, Finance will ignore your ROI.
3) Overestimating adoption
A system only creates savings if people use it consistently. If managers do not approve on time or HR keeps manual workarounds, ROI shrinks.
4) Measuring too late
If you do not track baseline metrics in the first month, you lose the proof later.
5) Treating HR, payroll, IT, and hiring as separate worlds
Onboarding, exits, and hiring cut across multiple teams. When tools are disconnected, rework grows.
Avoid these pitfalls and you’re already ahead of most ROI cases. Next, let’s look at the practical steps that increase ROI after implementation.
Standardise workflows before adding complexity
If each team has a different process, automation becomes messy.
Start with:
standard payroll cycles
clear leave rules
consistent employee data fields
structured onboarding checklist
standard hiring stages if using an ATS
Make employee and manager self service non negotiable
If employees cannot update data, download payslips, raise requests, and track status, HR becomes a helpdesk.
Set expectations early:
employees use self service for routine actions
managers own approvals and updates
recruiters and hiring managers use the ATS consistently if included
Consolidate overlapping tools on purpose
Do not keep old tools “just in case” for six months. Plan a retirement timeline and communicate it.
Integrate payroll and finance workflows
The faster you sync payroll outputs with accounting workflows, the quicker Finance buys in.
Use reporting to prevent problems, not only to explain them
Monthly HR reporting should help you spot:
approval bottlenecks
recurring payroll issues
high query drivers
policy loopholes
hiring stage bottlenecks and drop offs (if using ATS)
That is how ROI becomes a management system, not just a purchase justification.
Now, let’s connect all of this back to how Craze supports ROI in real operations.
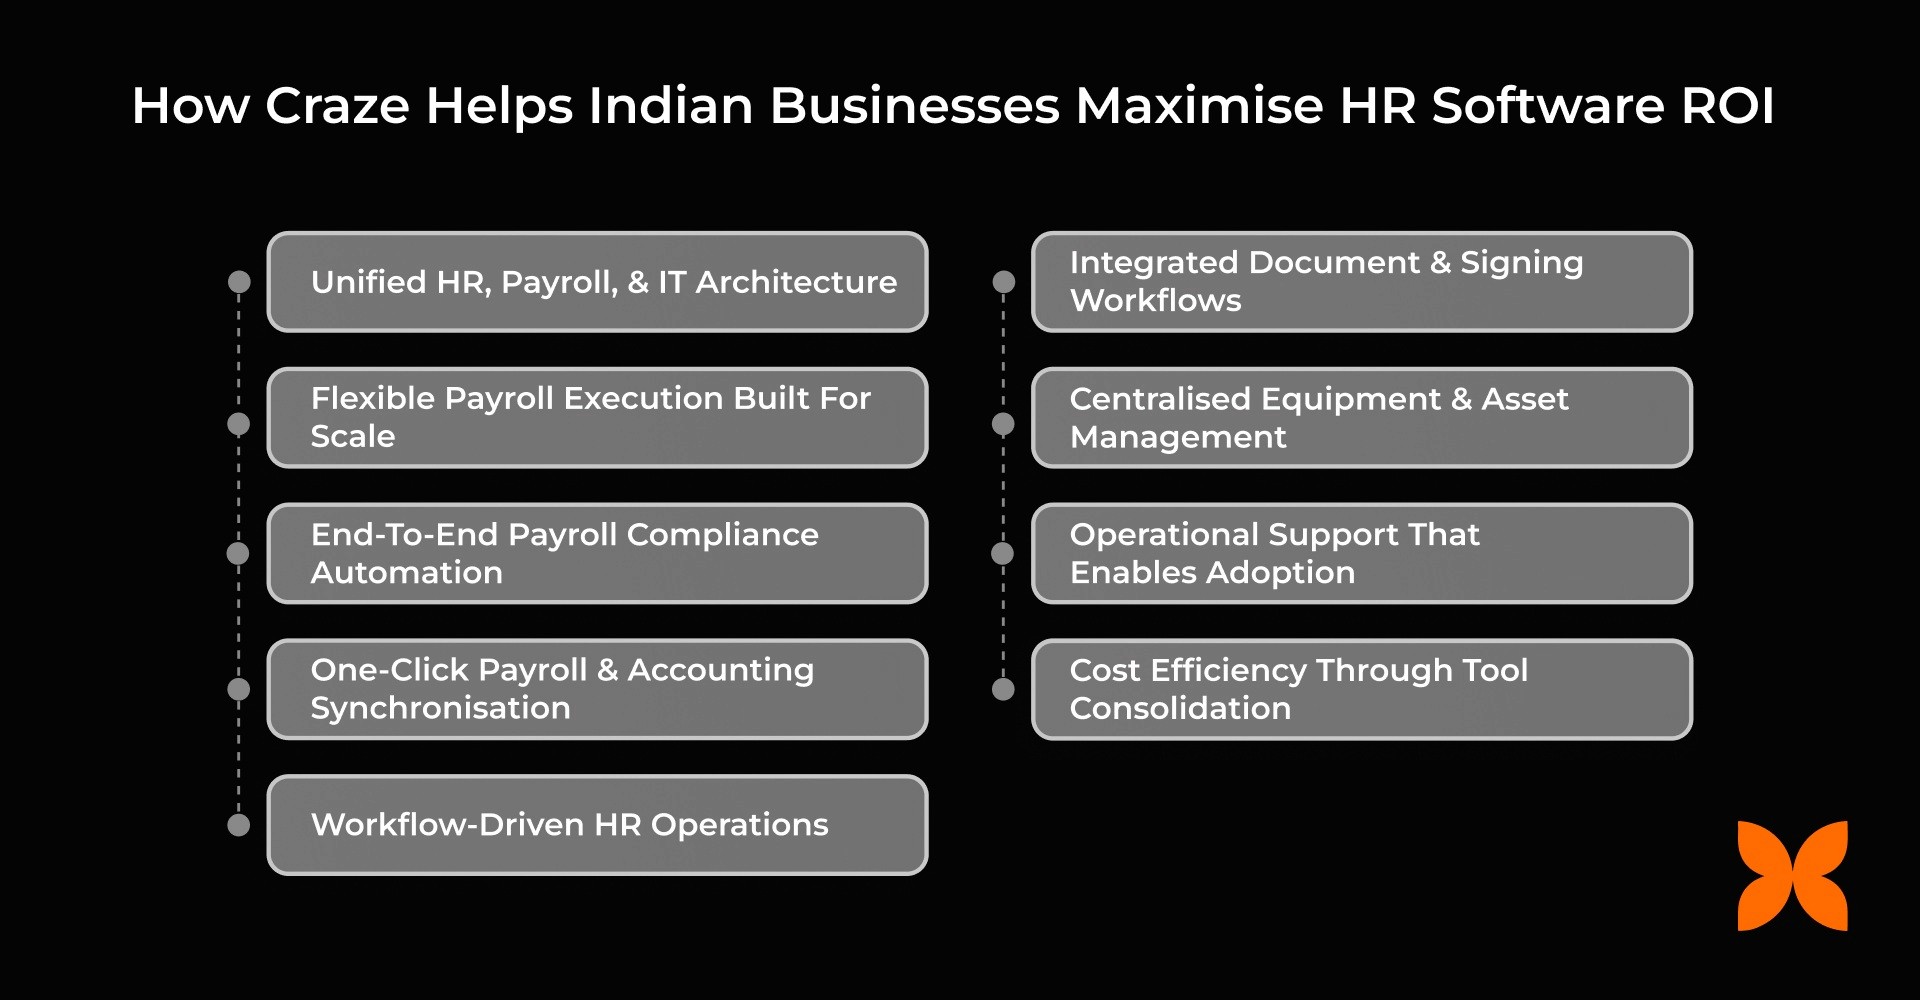
Craze is built to reduce operational drag across the employee lifecycle by connecting Core HR, payroll, compliance, IT workflows, and recruitment in one system.
That matters because ROI improves when you remove handoffs and rework.
With Craze, teams typically see ROI drivers like:
less time spent running payroll and fixing issues
fewer manual reconciliations between tools
smoother onboarding with structured workflows
stronger compliance reporting consistency
clearer asset issuance, tracking, and recovery
faster hiring workflows and better visibility with built in ATS and recruitment tracking
If your current HR stack feels like five tools and ten spreadsheets, the biggest ROI lever is often consolidation plus workflow standardisation that can be solved with Craze, Want to know how? Schedule a free demo here.
To wrap it up, here is the simplest way to think about ROI going forward.
A strong HR software ROI case is not built on assumptions. It is built on:
a baseline that reflects how work happens today
a benefits model grounded in measurable changes
total cost of ownership, not just subscription fees
adoption plans that make the improvements real
a 30/90/180 day rollout that turns software into savings
When you treat HR software as an operating system for people workflows, returns become easier to measure, easier to defend, and easier to scale.
If you want to model HR software ROI for your organisation, take the worksheet structure above, plug in your baseline numbers, and build conservative and aggressive scenarios. It will immediately show you where the biggest levers are.
1) How long does it take to see HR software ROI?
Many businesses see early improvements in 30 to 90 days through time savings and fewer errors. A clear financial ROI is often easier to validate within 6 to 9 months once adoption stabilises and tool consolidation begins.
2) Does HR software ROI differ for smaller companies vs mid sized companies?
Yes. Smaller teams often see ROI through admin time savings and basic automation. Mid sized teams see additional ROI from reduced compliance risk, better workflow governance, and retiring multiple tools.
3) Which processes usually deliver ROI the fastest?
Payroll processing, leave workflows, onboarding administration, employee self service, and recruitment workflows (if you use ATS) often deliver early ROI because they are repetitive, high volume, and prone to manual delays.
4) Should intangible benefits be included in ROI?
Report them, but do not force them into the ROI number. Intangibles like employee experience and better decision making support the business case, but tangible savings keep the ROI figure credible.
5) Can we measure ROI without historical data?
Yes, using conservative estimates. Track baseline metrics immediately after implementation so you can replace assumptions with real numbers over the first 30 to 90 days.